

How to Check Account Resource Usage in DirectAdmin
Check CPU, memory, tasks, and I/O in DirectAdmin, compare maximums and averages, and review overall account resource usage.
DirectAdmin lets you review both overall hosting usage and graphs of your account's processes. Use the appropriate period and data type to investigate slow performance or limits being reached.
1. Review the account summary
On the dashboard, the Your Account column shows disk space, bandwidth, inodes, and email, FTP, and database counts. The values to the right of each usage figure correspond to your service limits.
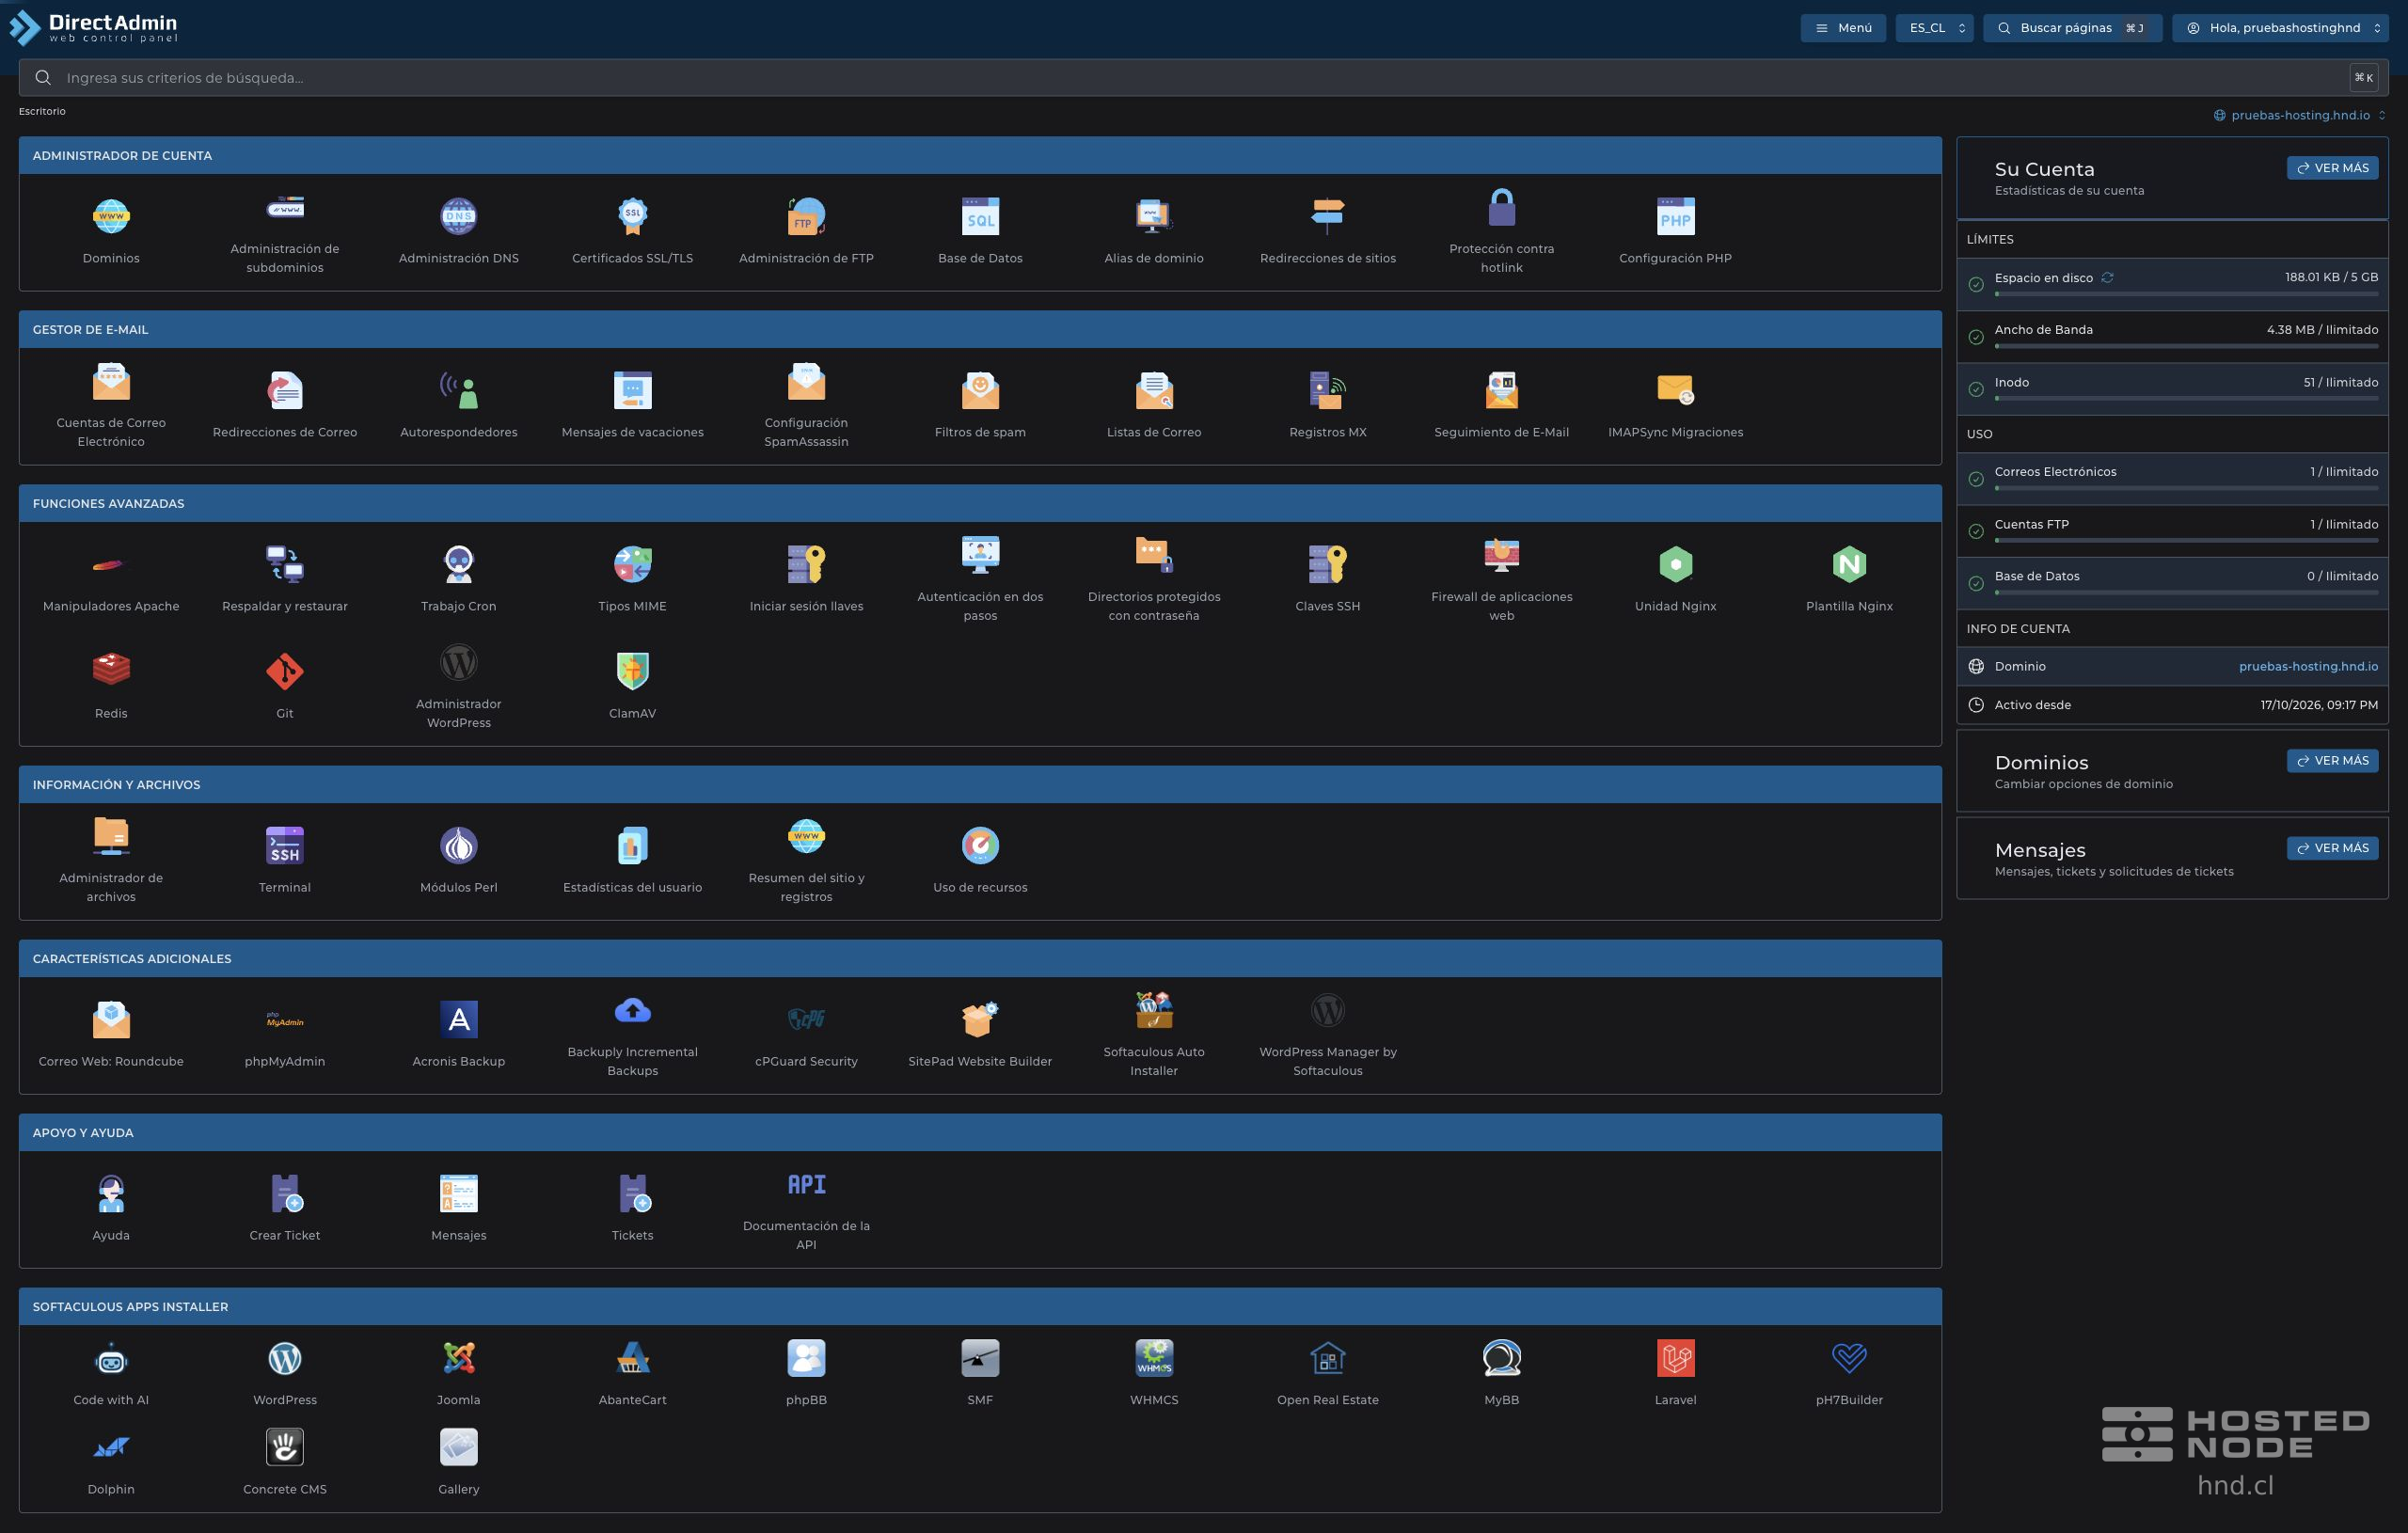
Bandwidth is the accumulated traffic shown for the account; it is not the disk's instantaneous read and write speed. The inodes represent file system entries. To view more general information, use View more or System Info & Files → User Statistics.
2. Open Resource Usage and choose a period
Go to System Info & Files → Resource Usage.
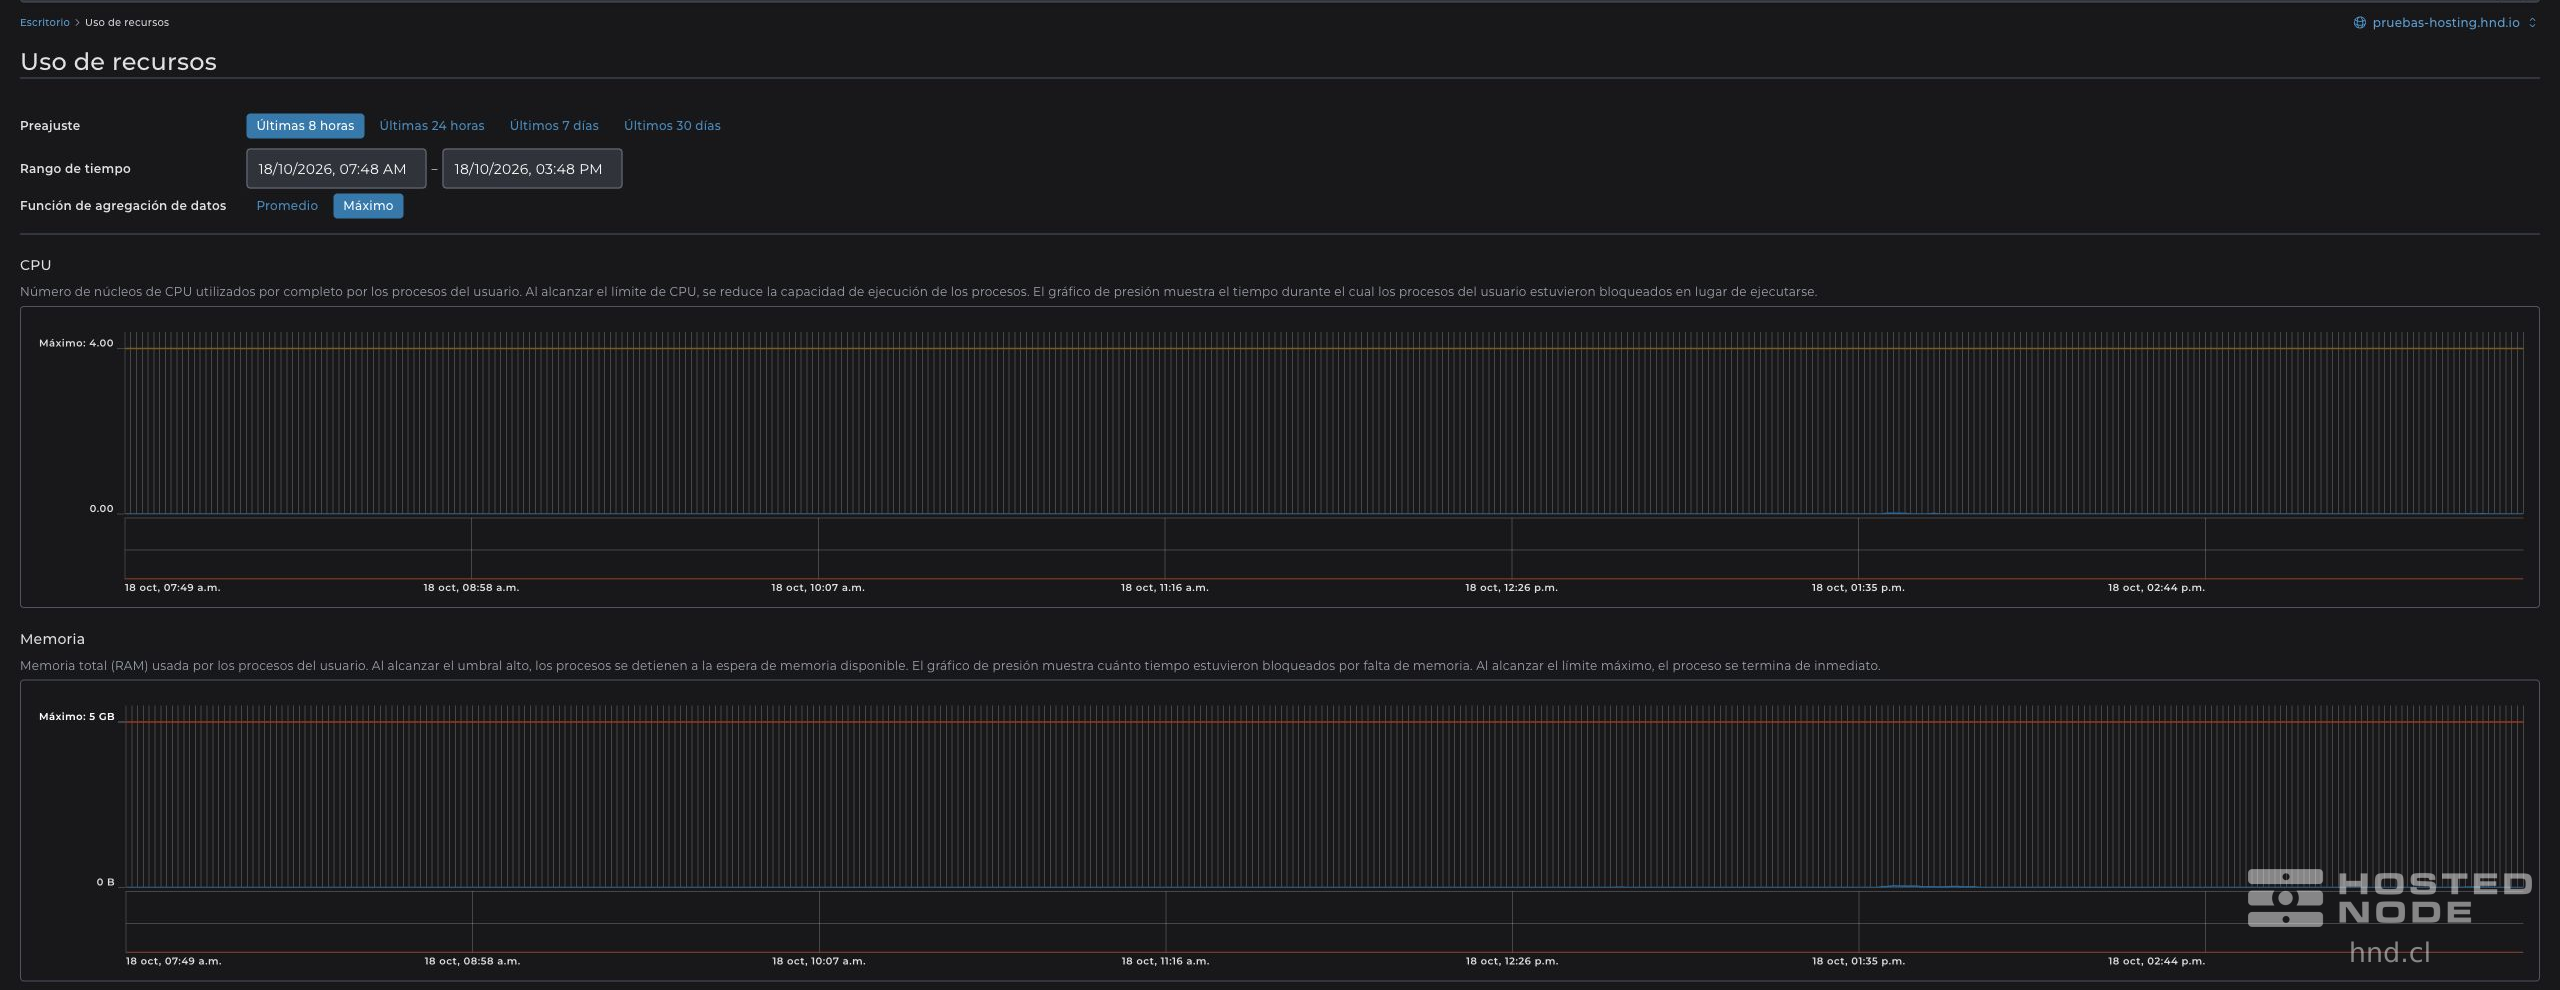
Select a preset: Last 8 hours, Last 24 hours, Last 7 days or Last 30 days. You can also check the Time Range.
Choose Maximum to look for spikes or Average to see average behavior over the interval.
Check the dates before interpreting the graphs.
3. Interpret the graphs
CPU: indicates the cores used by processes. Reaching the limit reduces the available execution capacity.
Memory: shows RAM usage. The high threshold can slow down processes, and reaching the maximum can terminate them.
Tasks: includes processes and threads. When the limit is reached, the creation of new processes may fail.
Transfer rate: lets you view bytes per second or read and write operations per second.
The pressure graphs, when displayed, reflect the time during which processes were blocked waiting for resources. An isolated spike does not prove a problem on its own: check its duration and whether it coincides with the time of the failure.
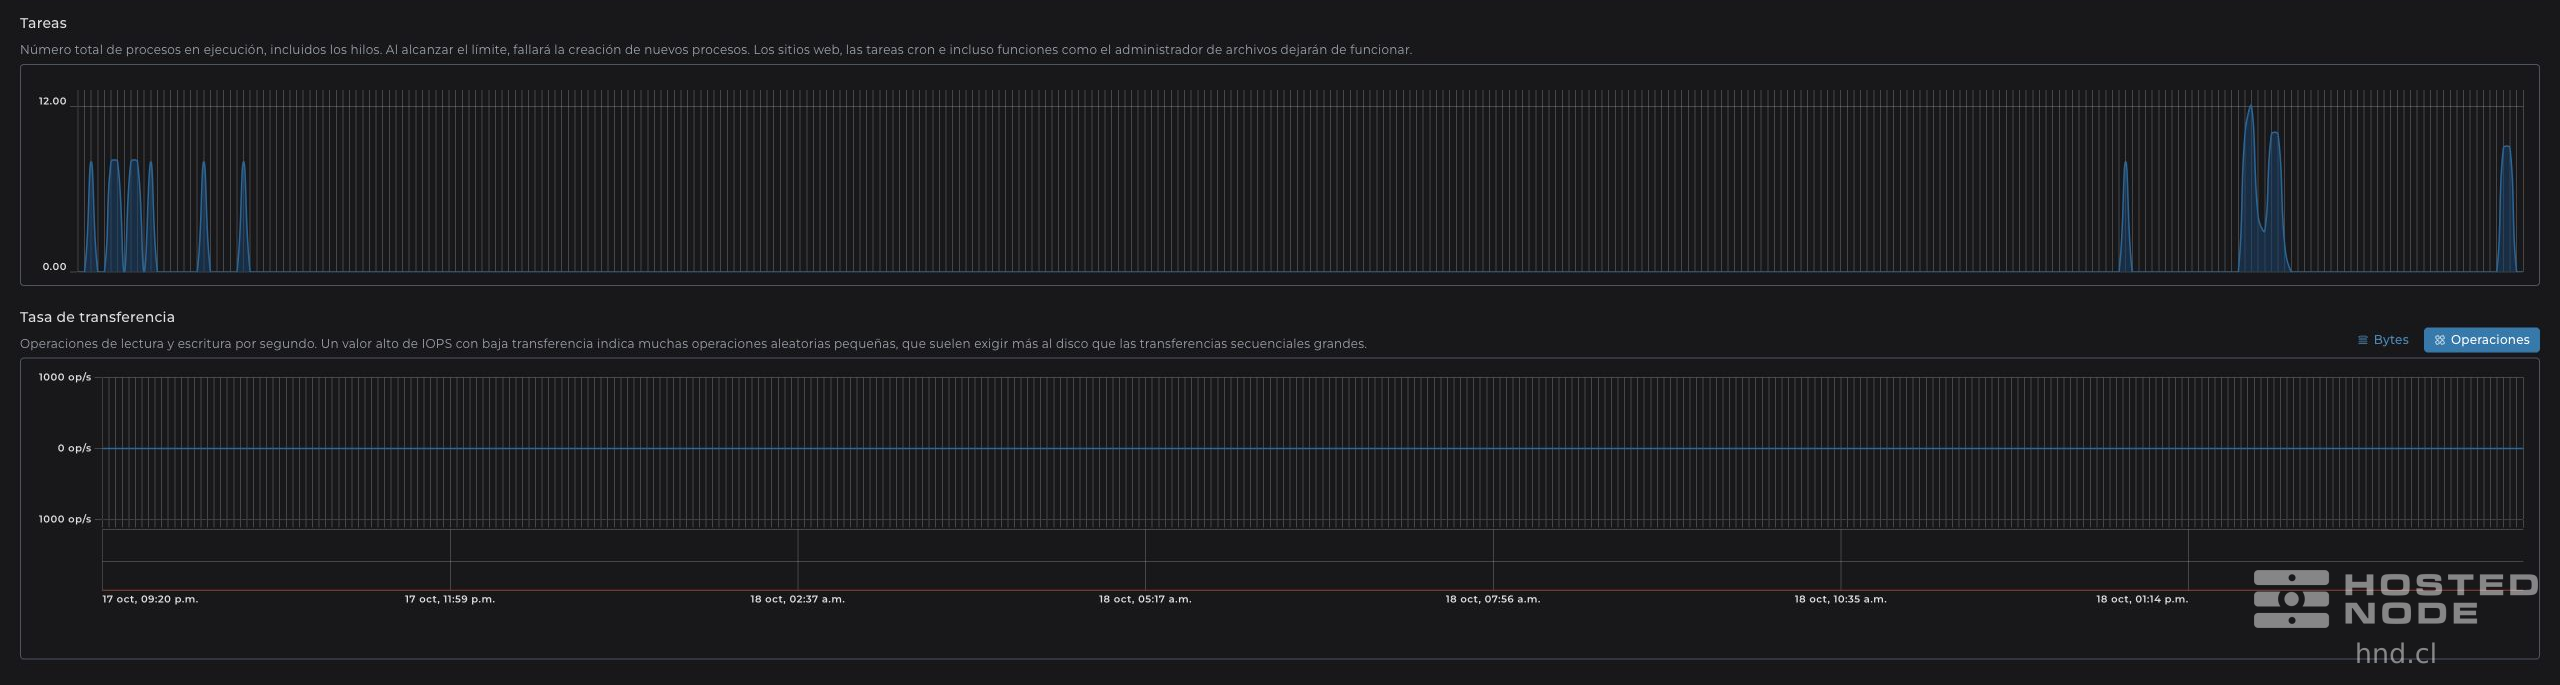
On the disk graph, click Bytes to measure volume or Operations to review IOPS. Many small accesses can produce a large number of operations with little data transferred.
4. Gather useful information
Note the domain, the time of the incident, the selected period, the maximum or average values used, and which resource reaches its limit. Compare that time with the site's usual tasks.
If no data appears, check the period and whether the tool is available with your service. An empty graph does not prove zero usage. If you need help, share a screenshot of the graph and the time of the problem with support, without passwords or visitors' private information.